Can you link me pls? I'm very torn in general about the path we should be following.
From the Telegraph...
https://www.telegraph.co.uk/news/20...wrong-death-toll-will-not-surpass-first-wave/
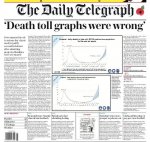
Covid graphs were wrong in suggesting daily deaths would soon surpass first wave'
Government forced to reissue key charts used to justify second lockdown after admitting projected fatalities were overstated
Official projections which pushed the country into a second lockdown have been quietly revised to no longer suggest deaths could soon overtake those at the peak of the first wave, The Telegraph has learned.
Graphs presented at a televised Downing Street press conference on Saturday suggested that the UK would see up to 1,500 Covid deaths a day by early December, far beyond the numbers seen in the first wave.
But documents released by Government show that the figures were far too high and have been "amended after an error was found". The forecast has been revised, reducing the upper end of the scale to around 1,000 deaths a day by December 8 – on a par with the peak of the pandemic in April.
Projected daily Covid-19 deaths comparison charts
Presenting the graphs on Saturday, Sir Patrick Vallance, Boris Johnson's chief scientific adviser, said the statistics, which covered a six-week period, presented "a very grim picture" with "greater certainty" than long-term modelling could provide.
But the Government Office for Science has now corrected two of the slides, reducing both the upper end of the range for deaths and that for hospital admissions by one third. While the presentation suggested daily hospital admissions could reach up to 9,000 in early December, the upper end of the range has now been cut to 6,000 in the updated slides.
It comes days after it emerged that separate modelling showing a worst-case scenario of 4,000 deaths a day by the end of December was based on out of date data which has also since been updated.
The revelation prompted former Prime Minister Theresa May to question the Government's use of statistics and ask whether "figures are chosen to support the policy rather than the policy being based on the figures".
On Thursday night, leading scientist Professor Carl Heneghan, of Oxford University, said the graphs presented at the weekend had been found to be "riddled with errors", raising concern that a desire for lockdown had seen forecasts "systematically" exaggerated.
Greg Clark, the chairman of the Commons science and technology committee, said the belated admission of errors was "of great concern", adding that the changes to the upper range in the forecast on hospital admissions was particularly concerning as this was "the key projection" in the case for lockdown.
Steve Baker, a backbench Tory MP given advance sight of the projections ahead of the Downing Street briefing, said: "Government must accept that public confidence rests on not over-egging the pudding."
On Thursday, the UK statistics watchdog criticised the Government for a lack of transparency about the data driving its lockdown policies, warning that the failings could create confusion and undermine public confidence.