Skip155
Vital Champions League
Released the season's first effectiveness charts today...

Shackell too'Only' big John in the team of the month? Something for his critics to contemplate.
Found it.
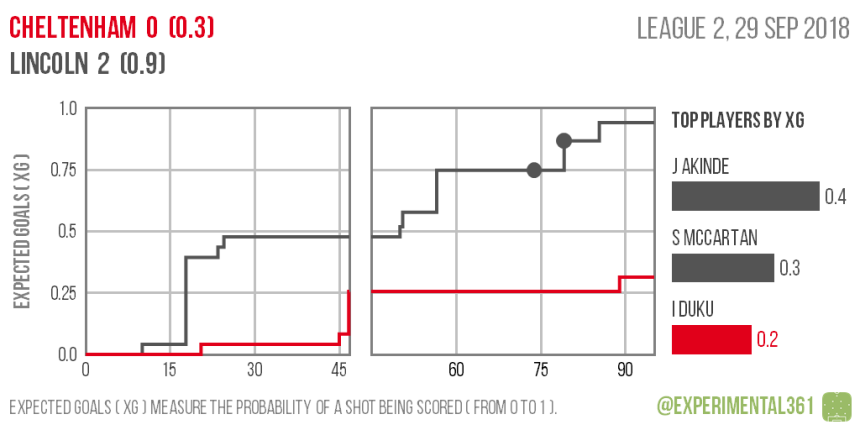
Depends which version you're looking at - Shackell makes left wing-back (!!) for September, Akinde left in a front 3 but leads the line in season to date.Shackell too


